Appearance
Release 1.3.0 (May 31, 2023)
Release 1.3.0 brings substantial new functionality to the Kurloo Nest, with the introduction of GeoTIFF map overlays. hourly GNSS processing
GeoTIFF Overlay
The Kurloo Nest uses Google Maps satellite view as the default map background to help you visualise your project. There are limitations around the usefulness of Google's imagery since it is relatively low resolution, is infrequently updated, and it is not orthorectified. For project sites that have changed significantly since the latest satellite image was loaded it can mean the background map image does not adequately represent the site.
To overcome that limitation, Kurloo have developed functionality where a custom GeoTIFF image can be used to visualise the site. These images are typically generated by drone flights of the site or by services supplying satellite imagery. If you have a GeoTIFF of your site that you would like to use, or you would like advice on how to create a suitable GEOTIFF, please contact Kurloo Support for assistance.
Size limit and file specifications
| File Format | PROJ_DESC | PROJ_DATUM | PROJ_UNITS | EPSG_CODE | Ground Pixel Resolution | File Size |
|---|---|---|---|---|---|---|
| Geotiff (*.tiff) | Geographic (Latitude/Longitude) / WGS84 / arc degrees | WGS84 | arc degrees | 4326 | 10cm (Recommended) | Less than 500Mb |
Hourly GNSS Processing
The Kurloo Nest version 1.2.0 and earlier processed data at 11:00am AEST regardless of when the data was collected. Starting from version 1.3.0, the Kurloo Nest will process the GNSS data received from your devices within 1 hour of reception. This change means that your data will be made available to you shortly after it has been collected.
Bulk Node Data Export
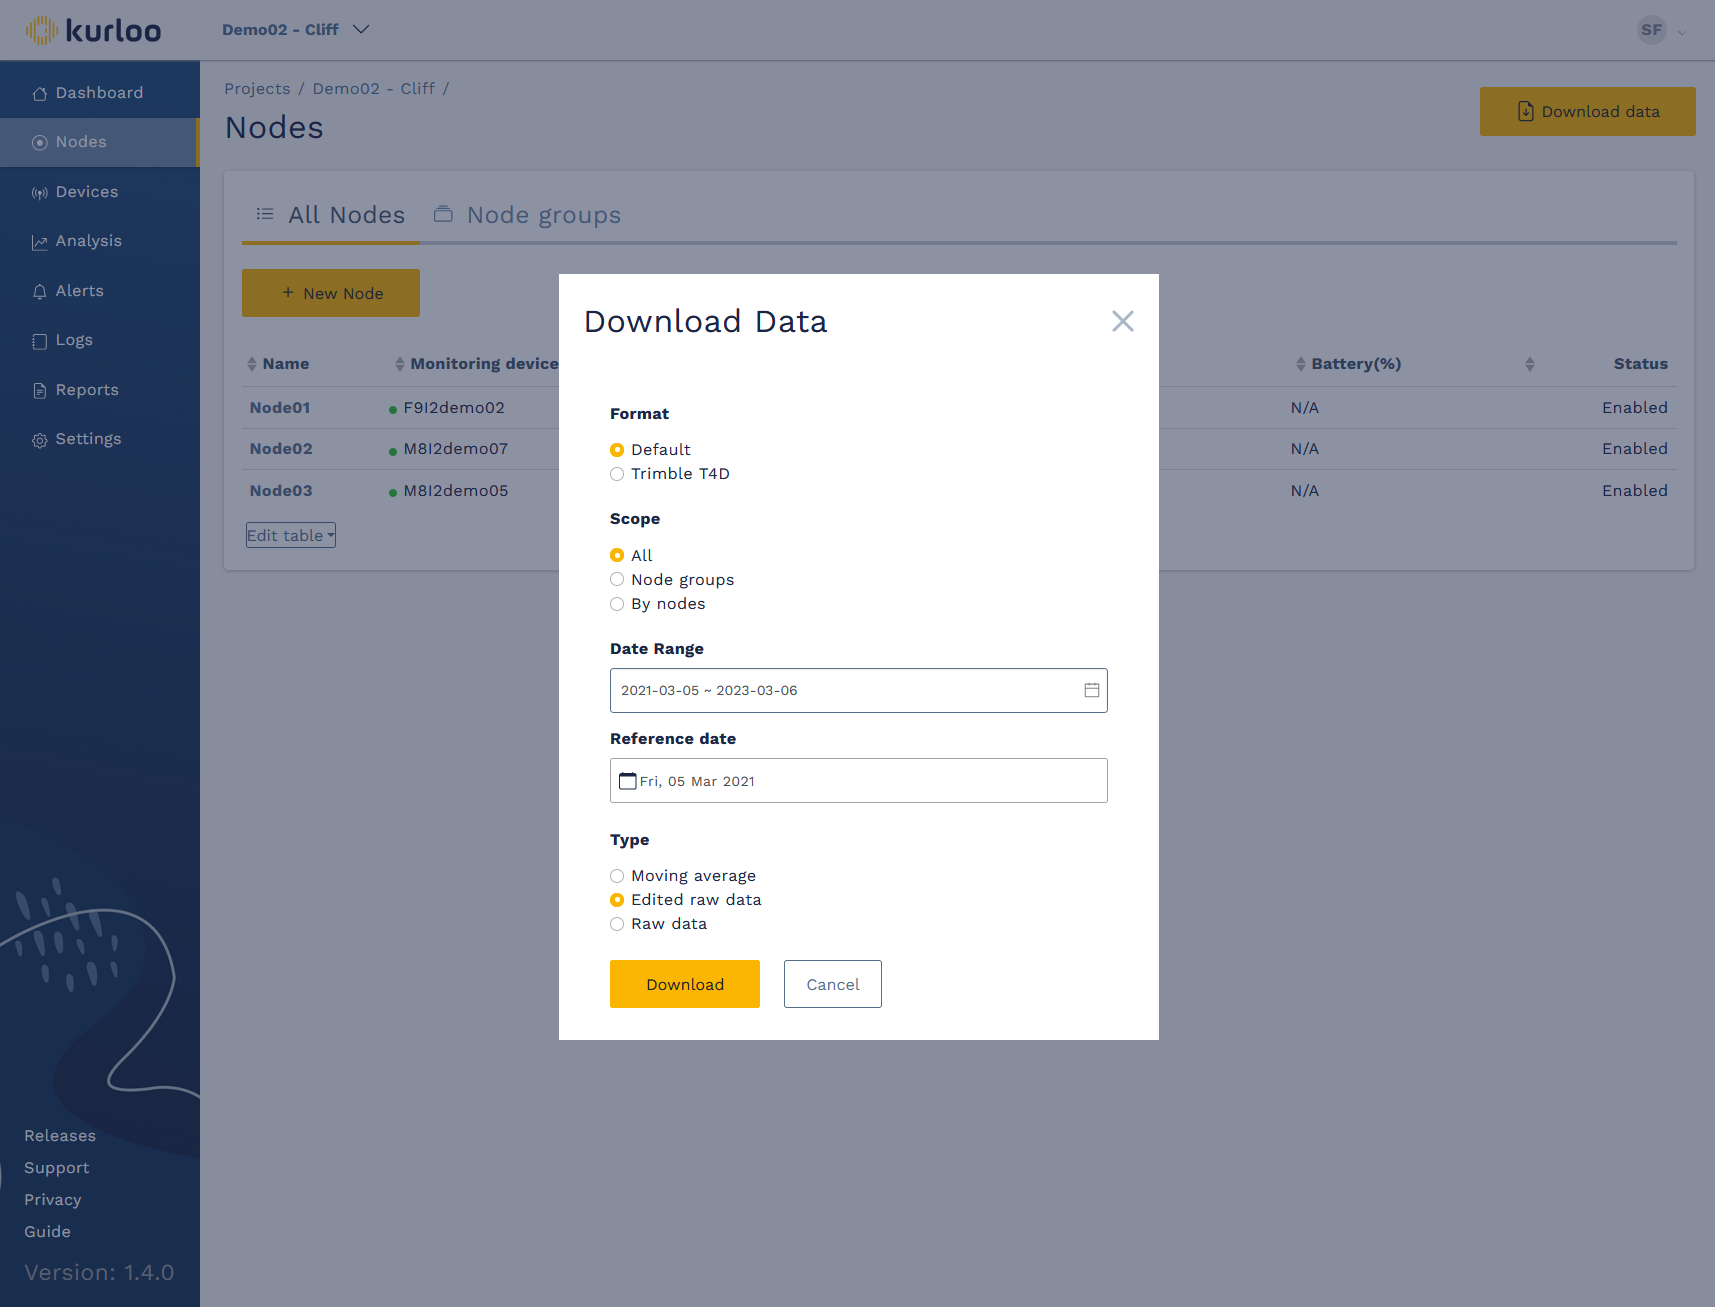
Kurloo Nest v.1.3.0 expands on the existing data export functionality by allowing you to download all of your project data at once. The bulk export can be filtered by date and nodes, and the data source can be chosen from Moving Average, Edited Raw Data and Raw data sources.

Customisable Table Columns
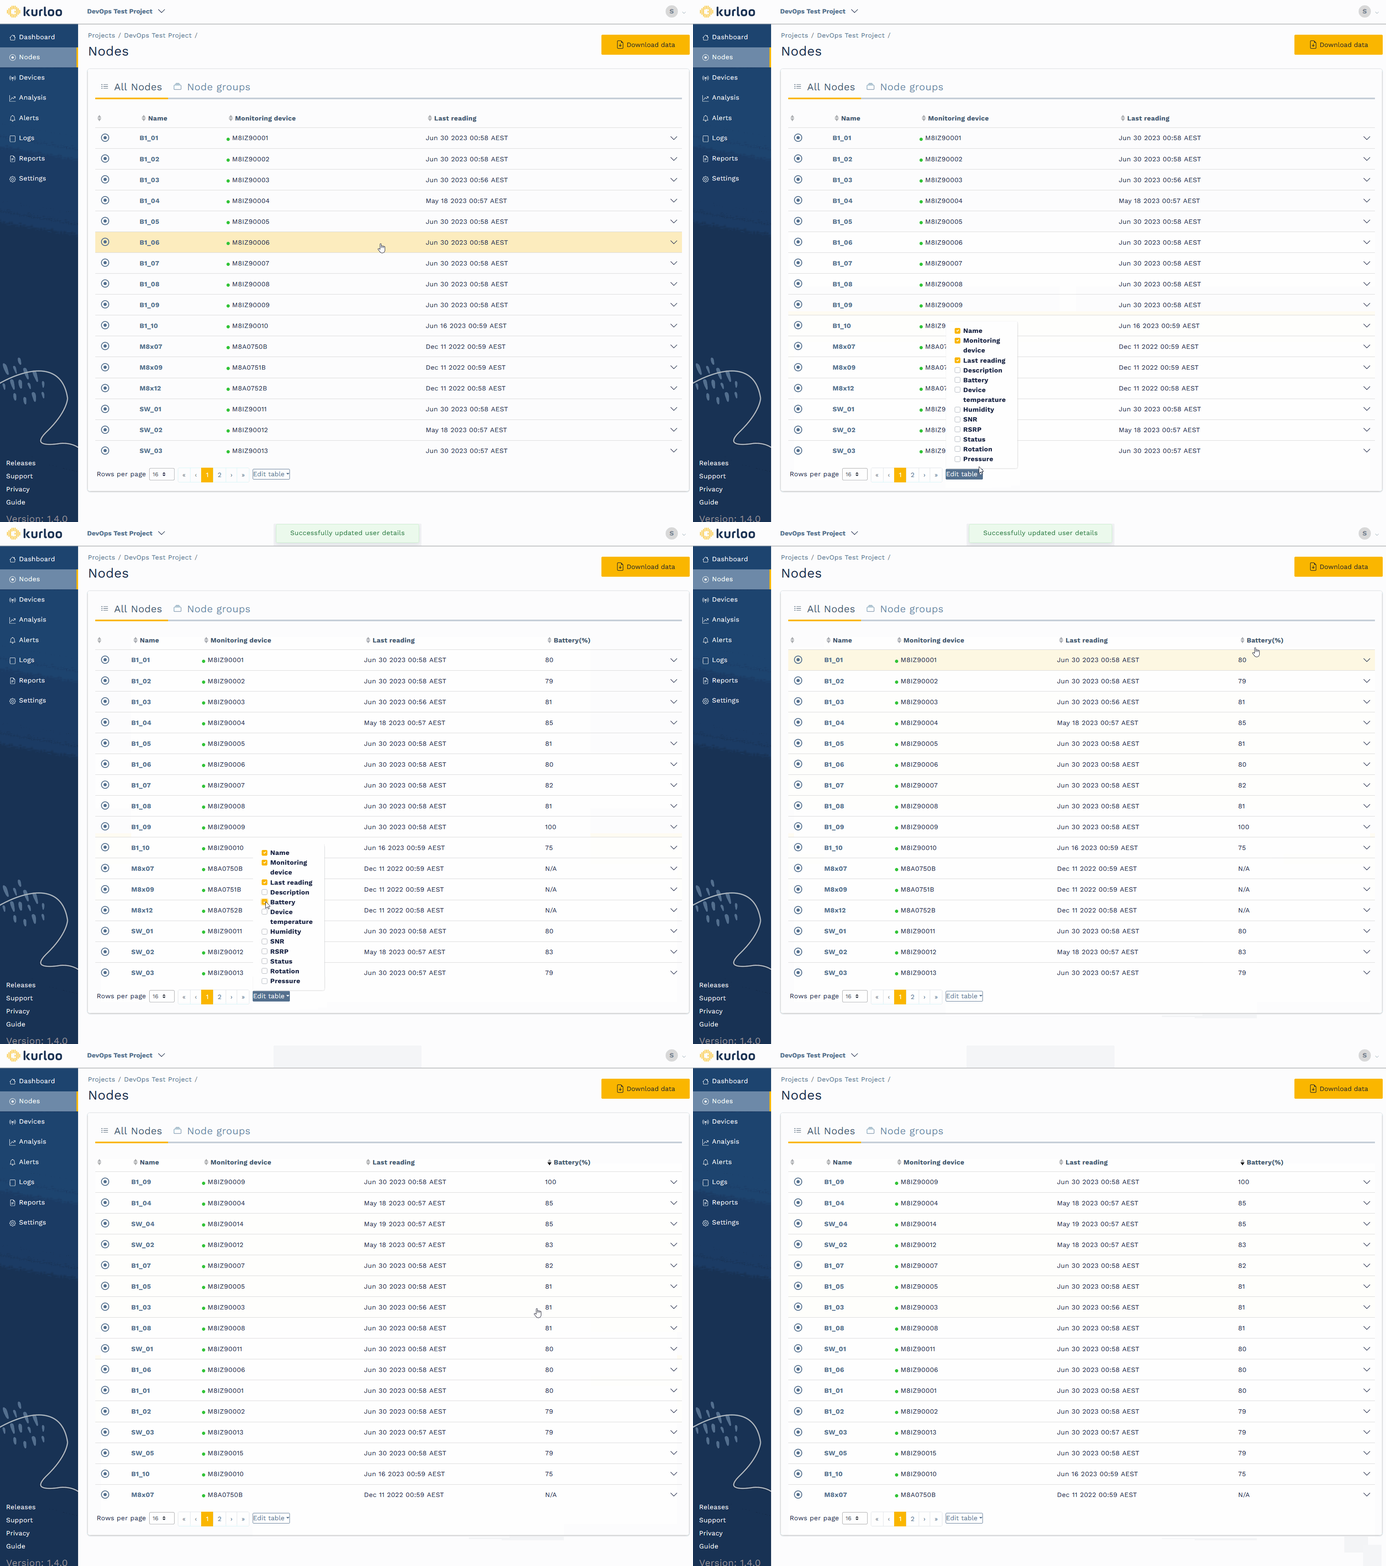
You are now able to select which columns to show in numerous tables shown throughout the Kurloo Nest. On the node list, for example, you can show various device statuses in the table. This lets you easily see the battery status of all of your nodes, and lets you sort the list to see which nodes have low levels of charge at a glance.

You will find numerous tables around the Kurloo Nest can now be customised in the same way so that you can see your data more efficiently.
